Gold Investing: History, Recent Surge, and the Case for Gold
Mahmoud Almahroum
Software Engineer
The Enduring Allure of Gold
In 2022 I decided to start investing in gold. This blog is a summary of my journey and what I've learned along the way. Gold has served as a symbol of wealth, a store of value, and a medium of exchange across civilizations for thousands of years. Unlike other commodities, gold's unique physical and chemical properties its durability, scarcity, and resistance to corrosion have made it the premier asset throughout history.
As Saifedean Ammous explains in The Bitcoin Standard, gold's role as money is rooted in its ability to maintain value over time, thanks to its high stock-to-flow ratio and the difficulty of increasing its supply.
Why Do People Invest in Gold?
People invest in gold for several key reasons:
Store of Value
Gold is seen as a hedge against inflation and currency devaluation. Its supply grows slowly (about 1.5% per year), making it resistant to the "easy money trap" that plagues other commodities and fiat currencies.
Safe Haven Asset
During times of economic uncertainty, geopolitical tension, or financial market volatility, investors flock to gold for its perceived safety and liquidity.
Portfolio Diversification
Gold often moves independently of stocks and bonds, providing diversification benefits.
Central Bank Demand
Central banks worldwide hold gold as a reserve asset, reinforcing its status as a global store of value.
The "Easy Money Trap" and Gold's Unique Role
Saifedean Ammous, in The Bitcoin Standard, contrasts gold with other commodities like copper. If a commodity is used as a store of value, increased demand will drive up its price, incentivizing producers to increase supply. For most commodities, this leads to a boom-bust cycle: prices rise, production surges, and eventually, prices crash, punishing those who tried to use the commodity as money.
Gold, however, is different. Its supply cannot be easily or rapidly increased, so it retains its value even as demand rises. This is why gold, and not copper nor oil, has served as the world's monetary standard for centuries.
Gold's Price Surge Since 2022
My Gold Investment Journey
I started buying gold in November 2022, when the price was around $1,700–$1,770 per ounce. As of July 2025, gold is trading near $3,330–$3,340 per ounce—a near doubling in less than three years.
Gold Price Chart: 2021-2025
The chart below illustrates gold's remarkable price trajectory over the past few years, showing the dramatic surge that began in 2022 and continues through 2025.
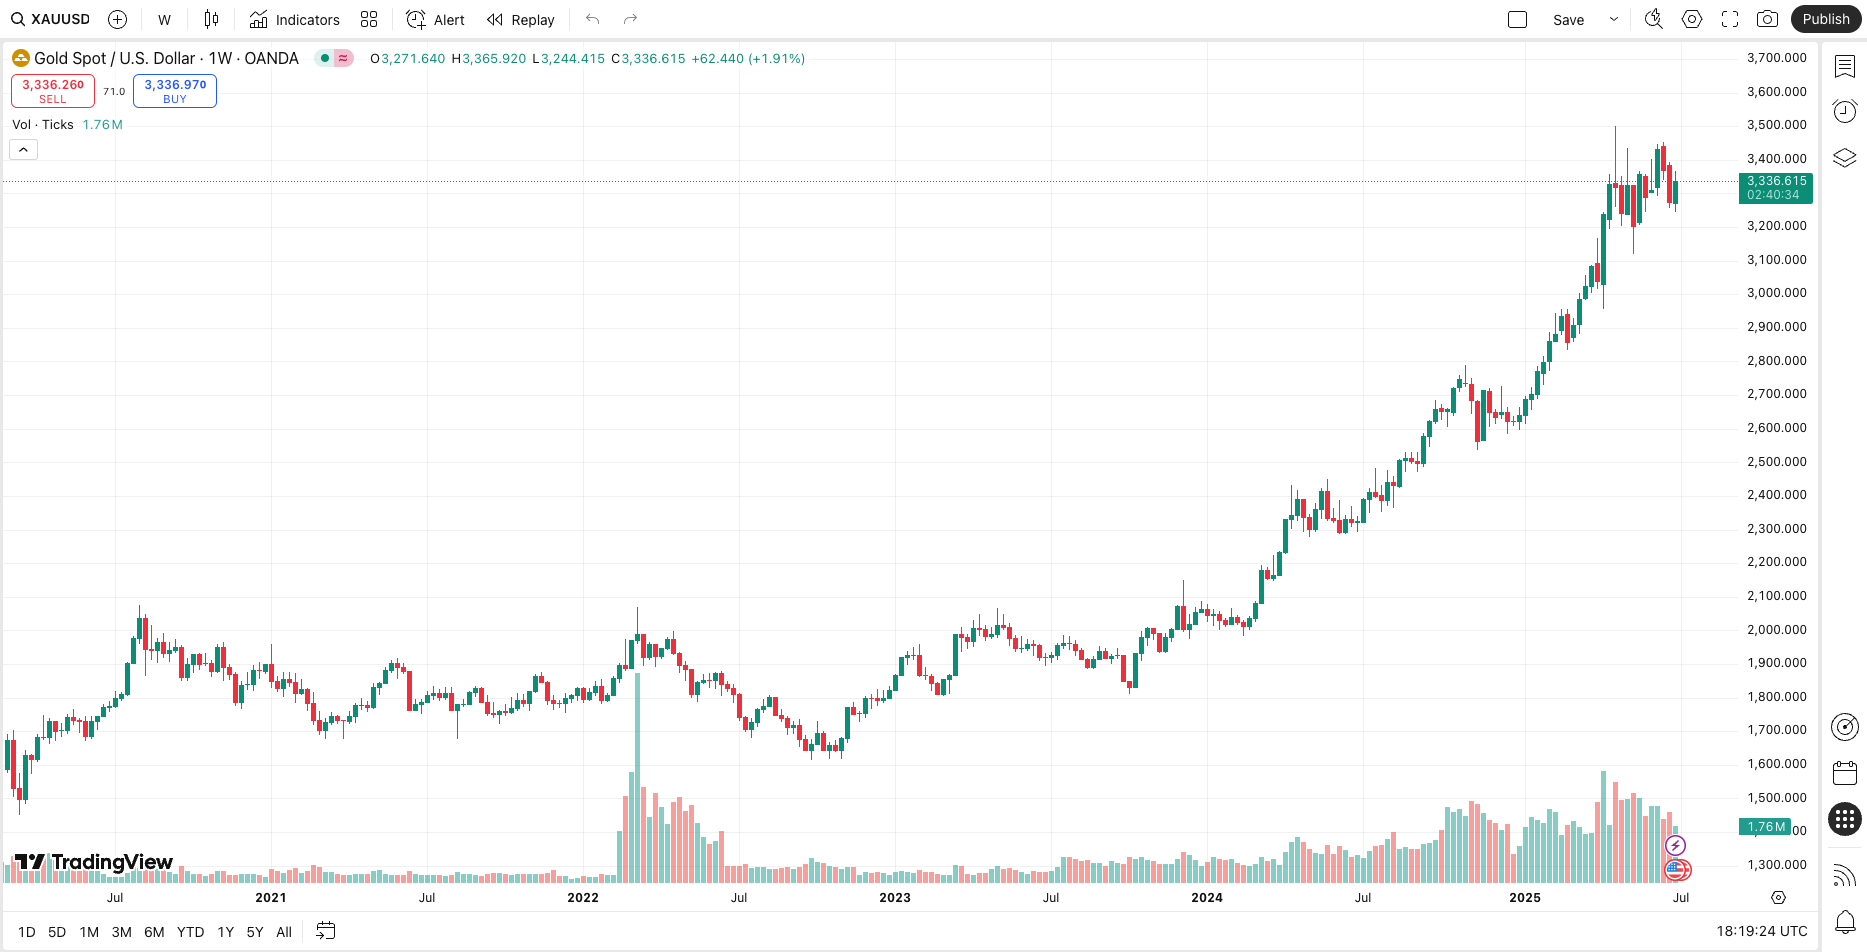
Gold price evolution from 2021 to 2025, highlighting the significant rally since 2022
Key Price Points
| Date | Gold Price (USD/oz) |
|---|---|
| Nov 2022 | ~$1,700–$1,770 |
| July 2025 | ~$3,330–$3,340 |
What's Driving the Recent Rally?
Several factors have contributed to gold's dramatic rise since 2022:
Geopolitical Uncertainty
The Russian invasion of Ukraine in February 2022 and subsequent global tensions led to a surge in central bank gold purchases, as countries sought to diversify away from assets vulnerable to sanctions or seizure.
Central Bank Demand
Central banks, especially in emerging markets like China, have been buying gold at record levels to reduce reliance on the US dollar and other Western assets.
Inflation and Interest Rates
Persistently high inflation following pandemic-era stimulus and supply chain disruptions, combined with expectations of lower interest rates, have made gold more attractive.
Economic Uncertainty
Fears of recession, volatile equity markets, and concerns about the health of the global economy have driven investors toward gold as a safe haven.
Shift in Reserve Management
The freezing of Russian reserves by Western governments prompted many countries to view gold as a "neutral reserve asset" further boosting demand.
Gold's Supply Expansion: Key Metrics and Trends
Annual Gold Supply Growth
Global gold supply increased by 1% in 2024, reaching a record high of 4,974 tonnes. This growth was driven by both higher mine production and increased recycling activity.
Mine production in 2024 was estimated at 3,661 tonnes, a fractional increase year-on-year and the highest level recorded in the past 30 years.
Global Gold Supply Components (2024)
3,661 tonnes
1,370 tonnes
Mine Production Trends (1995-2024)
55% increase over 25 years
Global Gold Supply Metrics (2023–2024)
| Metric | 2023 (tonnes) | 2024 (tonnes) | Year-on-Year Change |
|---|---|---|---|
| Total Supply | 4,945.9 | 4,974.5 | +1% |
| Mine Production | 3,644.1 | 3,661.2 | +0% |
| Recycled Gold | 1,234.4 | 1,370.0 | +11% |
Stock-to-Flow Ratio: Gold's Scarcity Metric
The stock-to-flow ratio is a key metric for understanding gold's scarcity. As of 2023, the total above-ground stock of gold was estimated at over 200,000 tonnes, with annual production around 3,000–3,600 tonnes.
This results in a stock-to-flow ratio of approximately 65–70, meaning it would take 65–70 years of current production to double the existing stock.
Stock-to-Flow Ratios: Gold vs Silver vs Copper (2024)
Gold
It would take 65–70 years of current mining to produce the existing global stock of gold.
Silver
It would take about 22 years of current mining to match the existing stock.
Copper
It would take about 1 year of current mining to match the existing stock.
Comparative Table: Stock-to-Flow Ratios (2024)
| Metal | Total Stock (tonnes) | Annual Production (tonnes) | Stock-to-Flow Ratio |
|---|---|---|---|
| Gold | ~200,000 | ~3,000 | 65–70 |
| Silver | ~1,750,000 | ~25,000 | ~22 |
| Copper | ~700,000,000 | ~22,000,000 | ~1 |
Figures are rounded estimates for 2024. Sources: World Gold Council, Silver Institute, International Copper Association, PlanB S2F model.
Key Insights
Gold has the highest S2F ratio among major metals, making it the most "monetary" and least susceptible to supply shocks.
Silver has a moderate S2F ratio, reflecting its dual role as a precious and industrial metal.
Copper has a very low S2F ratio, typical of industrial commodities, and is not suitable as a monetary asset due to its abundance and high production rate.
These ratios help explain why gold has historically served as the premier store of value and monetary metal, while silver and copper are more influenced by industrial demand and supply dynamics.
Top Gold-Producing Countries (2024)
The top 10 gold-producing countries collectively account for more than half of global mine output.
Summary
Gold's supply expands at a slow, predictable rate—typically around 1% per year—due to the physical and economic constraints of mining and the large existing above-ground stock. This slow expansion, reflected in gold's high stock-to-flow ratio, underpins its reputation as a reliable store of value and a hedge against inflation.
Lessons from The Bitcoin Standard
Ammous's analysis helps explain why gold, and not other commodities, has maintained its monetary role. Gold's chemical stability and the difficulty of increasing its supply mean that it is not subject to the same boom-bust cycles as other assets.
When people invest in gold as a store of value, they are not just betting on price appreciation they are seeking protection from the erosion of purchasing power that comes with inflation and monetary expansion.
Conclusion: Is Gold Still a Good Investment?
Gold's recent performance underscores its enduring appeal as a store of value and a hedge against uncertainty. While no investment is without risk, gold's unique properties and its historical role as money make it a compelling choice for those seeking stability in turbulent times.
As the world grapples with inflation, geopolitical shifts, and changing monetary regimes, gold's relevance as a safe haven and a monetary anchor remains as strong as ever.